ShowMe Premium: Analytics

Any teaching tool should come with a powerful analytics tool, and ShowMe is no exception. Using the analytics feature, you can track your students’ activity on both a cumulative and an individual level, identify points with which your students are struggling, and generate detailed progress reports for each student in your class.
Tracking Student Activity
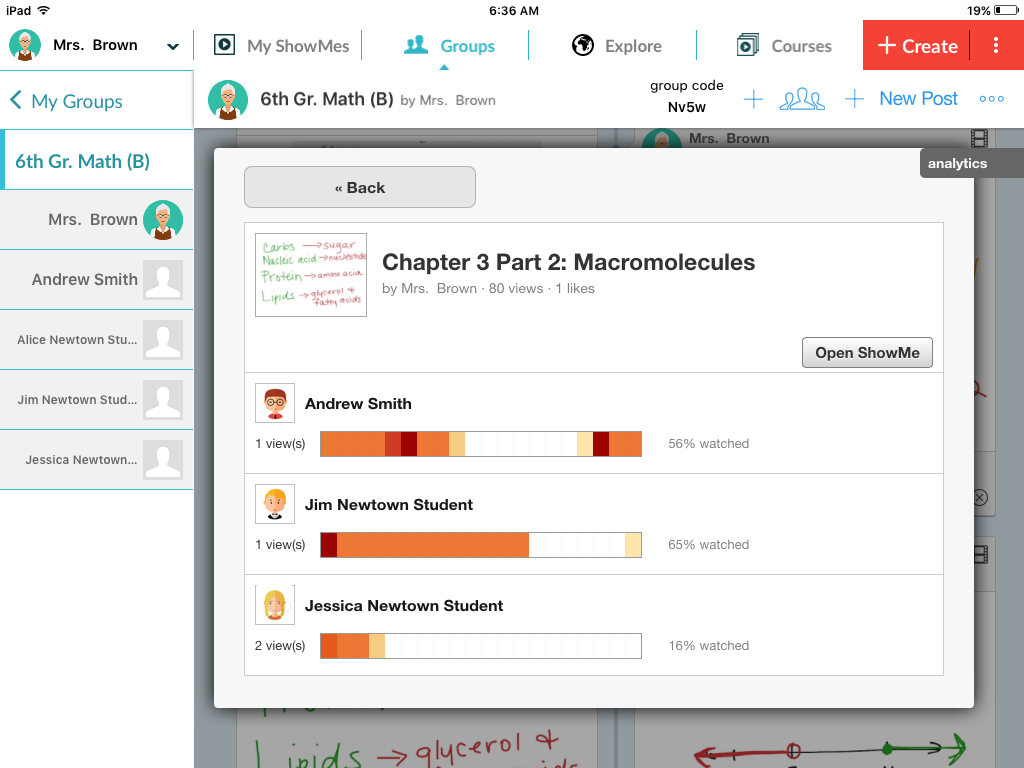
One of the analytics tool’s most important features is its ability to show your students’ individual activity in the ShowMe app to you. By going to your student roster for any given class, you can select a student to see how many ShowMes they’ve watched, which ones they’ve completed (or not completed), and which ones they’ve completed more than once—and if so, how many times they’ve watched them. This will give you an idea of how up-to-date they are.
Once you know who’s watching—or not watching—your content, you can begin to link behavioral or educational problems with ShowMe consumption. Naturally, there won’t always be a direct link, but it’s good to know which of your students hasn’t finished the coursework once your midterm grades come out so that you can present a coherent solution.
Identifying Problems
Another way that you can use the ShowMe analytic data is by pinpointing areas in which your students are struggling with the content. If a large group of your students seems to be getting stuck on a particular ShowMe—or even a particular part of a ShowMe—you’ll most likely notice in the analytics data. Once you’re aware of a problem, you can cover it in class, address the problem by tweaking the ShowMe, or talk to your students about their experiences with the problem.
The same goes for ShowMes that are resoundingly successful, of course. If you notice that a large group of students is completing ShowMes that you had originally thought of as advanced or difficult material, you may be able to rework your curriculum based on the group’s collective success in order to ensure that you’re still challenging them.
Finally, many problems that you run into with individual students can be solved by assigning customized or simplified ShowMes on a case-by-case basis.
Progress Reports
ShowMe completion rates give you a tangible statistic to use when reporting students’ growth. You can also compare the number of ShowMes a student was completing to the current number being completed to display progress, or you can look into the quality of work on individual ShowMes if you want to compare a specific student’s current work with that student’s past work.
This system is especially robust if your school uses ShowMe as a whole, as your student report can fit into a school- or district-wide report in order to facilitate a more accurate measure of your school’s overall progress—a method of reporting that’s much more dynamic and qualitative than current standardized testing.
ShowMe’s analytics are fairly standard, but they can affect powerful results that shape your classroom experience, both for individual students and for a class as a whole. Paired with the ability to create comprehensive reports on student growth, ShowMe’s analytics are key in understanding your class.
Get started with ShowMe Analytics today! Learn more »